How a new timeline and reorganizing the workspace cut curators' task time in half.
- Senior Product Designer
Tools
- Figma
- Miro
- Notion
- Posthog
Team
1 Product Designer
1 Developer
Timeframe
1 month
Sept 2025
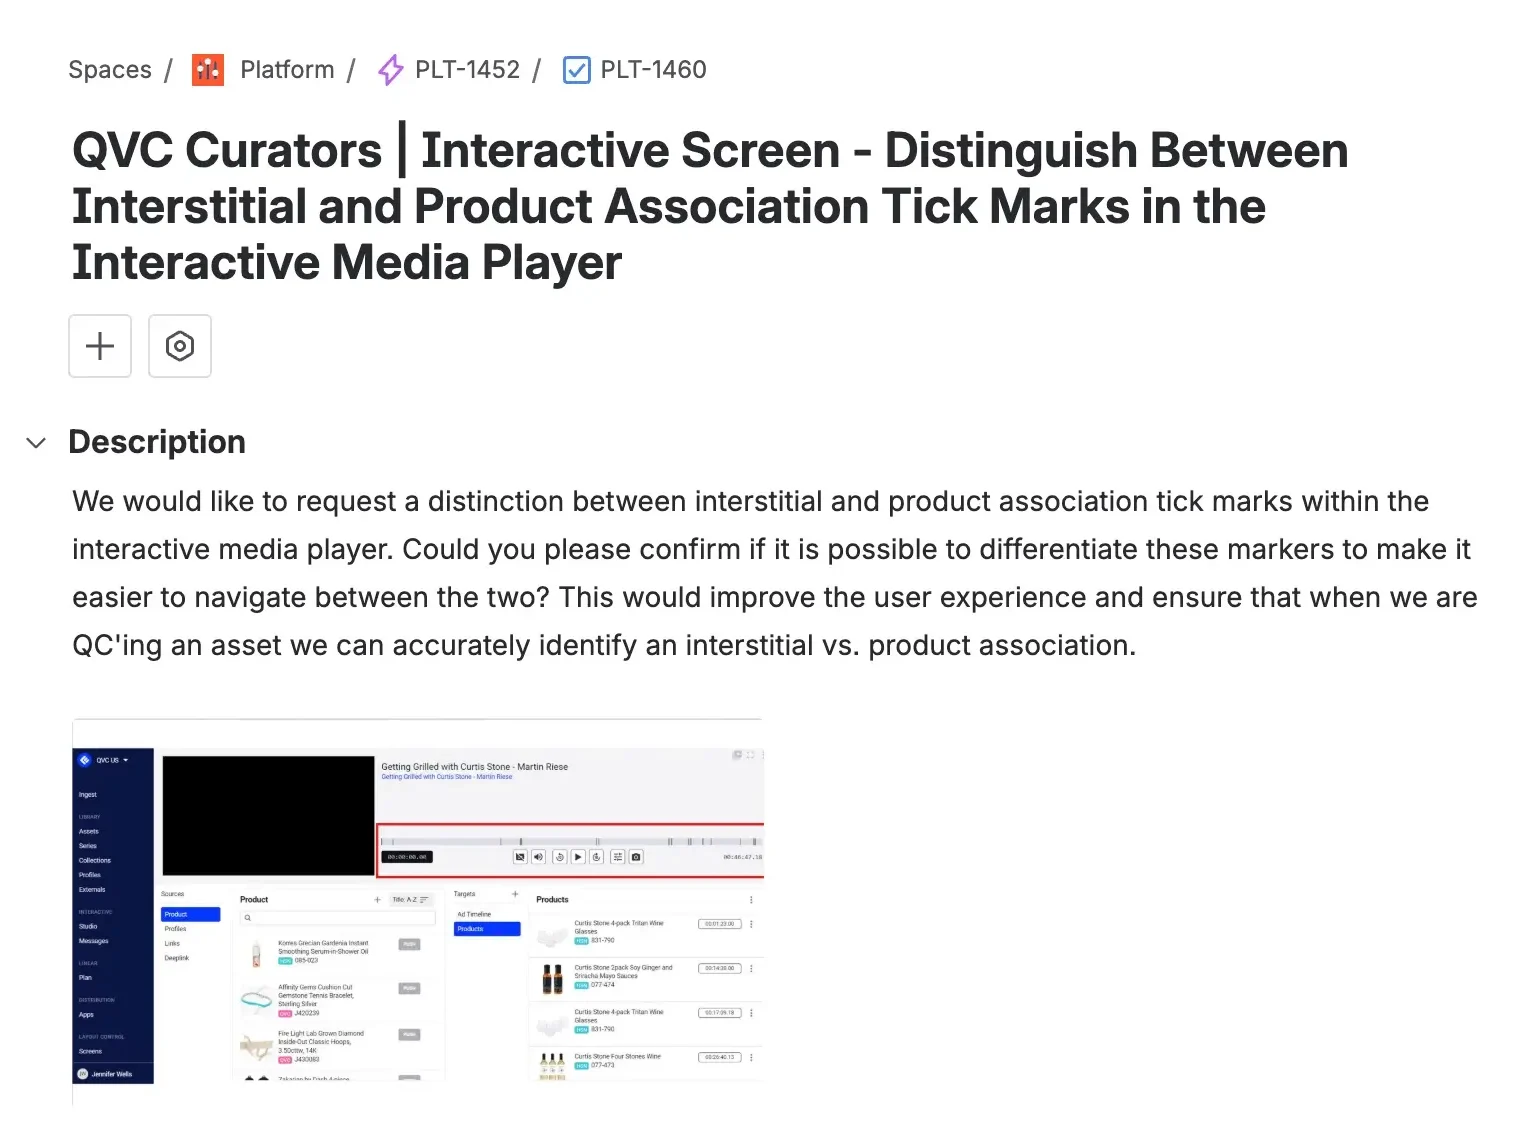
Introduction
QVC, the US streamer of choice for home shopping, uses Ediflo, Axonista’s enterprise video CMS to curate shoppable content for their live shows.
QVC curators were spending 35–60 seconds on what should take half that: finding a product and placing it at the right video timestamp. The Interactive space hadn’t kept pace with how they actually used it. I led the redesign of the timeline and panel layout, working with one developer over a month to ship meaningful improvements within tight legacy code constraints.
Problem
Curators were making constant errors placing product triggers, couldn’t find items quickly, and had no room to see clearly their products and ads within a video. Legacy code issues and tight deadlines ruled out most of the obvious fixes.
Solution
We reorganised the existing panels into a layout borrowed from established video editors, and used the time saved to build a new timeline from scratch. One that finally worked the way curators expected.
Impact
QVC Curators were able to speed up their overall process, which translates into more videos curated within their work time. They also benefited from more real space to check catalogue products, items that are currently inside a video, and a much better way to check triggers.
Improvements were evaluated using Posthog events to compare before vs after.
50
Time on Task Reduction
100
Ticket Issues Volume Drop
76
Timeline Interaction Rate Increment
Problem
The Challenge
Curators linked products to specific video timestamps, but the existing UI made this error-prone and slow. Triggers appeared as thin lines that were difficult to select accurately. Products and ads were hard to find quickly. And the panel layout was actively confusing: the third column controlled what appeared in the first and second, a pattern that made no sense to new users and wasn’t much clearer even for experienced ones.
The technical constraints were real. Significant debt in the codebase and larger priorities queued behind this project meant the brief was explicit: smallest changes, biggest outcomes. That shaped every decision.
Since a full panel redesign and a new timeline were both on the table, we knew the transition needed to be staged. We planned progressive iterations with feedback rounds at each step to avoid breaking users’ existing mental models mid-project
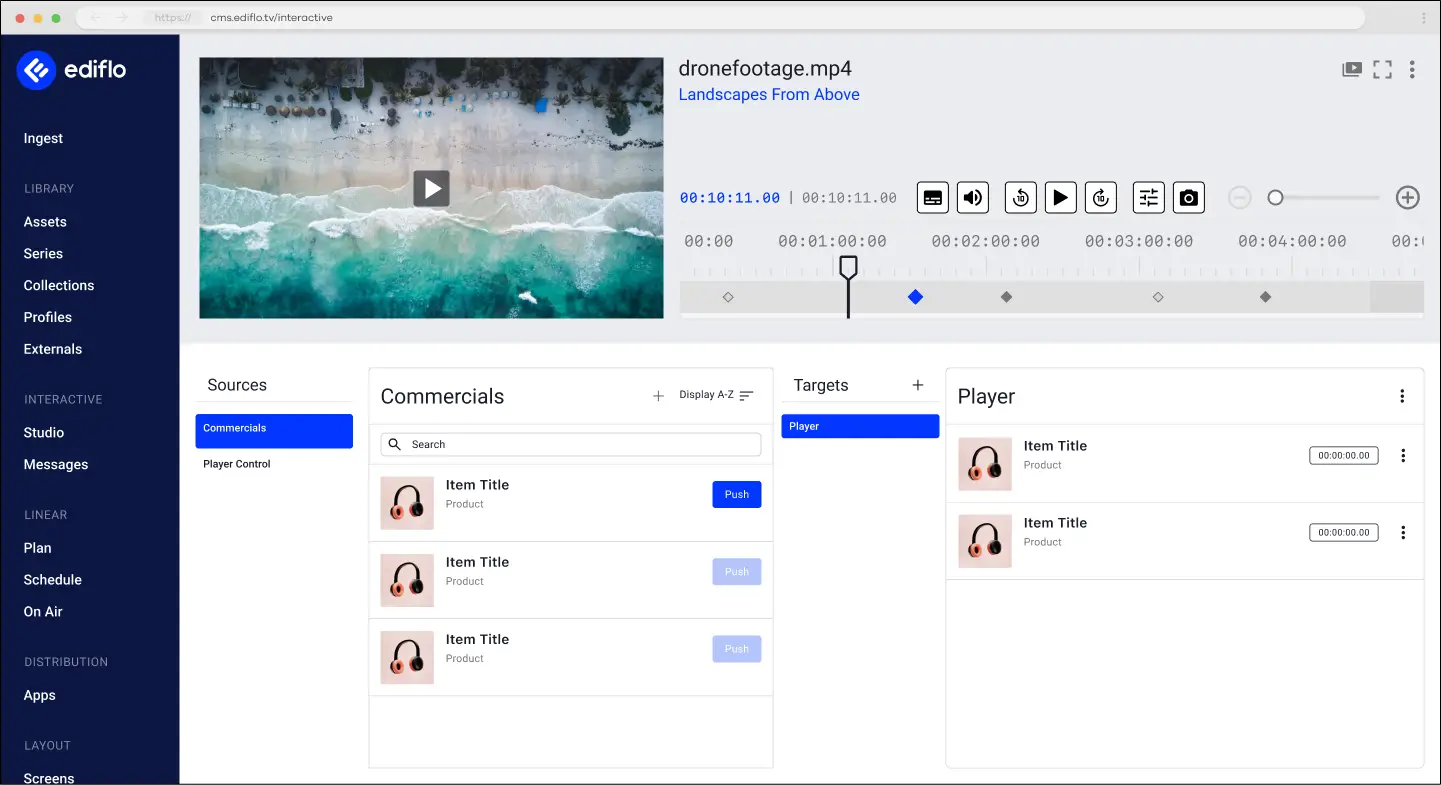
Video Player size restricted due to timeline width. Also, there is no back button present
Timeline is too small to be able to play with easily. Triggers are really thin, make it difficult to select the right one. Zoom in and Zoom out is not implemented, and moving between frames is only possible by dragging and hold, which is useful on mobile devices, but nor here in desktop.
The “Sources” panel acts a vertical tab for the next panel to select the relevant item. Since no more than these 4 items appear, there a lot of empty space here that can be used more gracefully.
This panel is positioned as the third column, but it actually changes the Source options on the first column, and the panel type for the second one. This is a really confusing behavior for first time users, since it doesn’t follow a recognizable pattern. Lot of empty space as well.
Desk Research
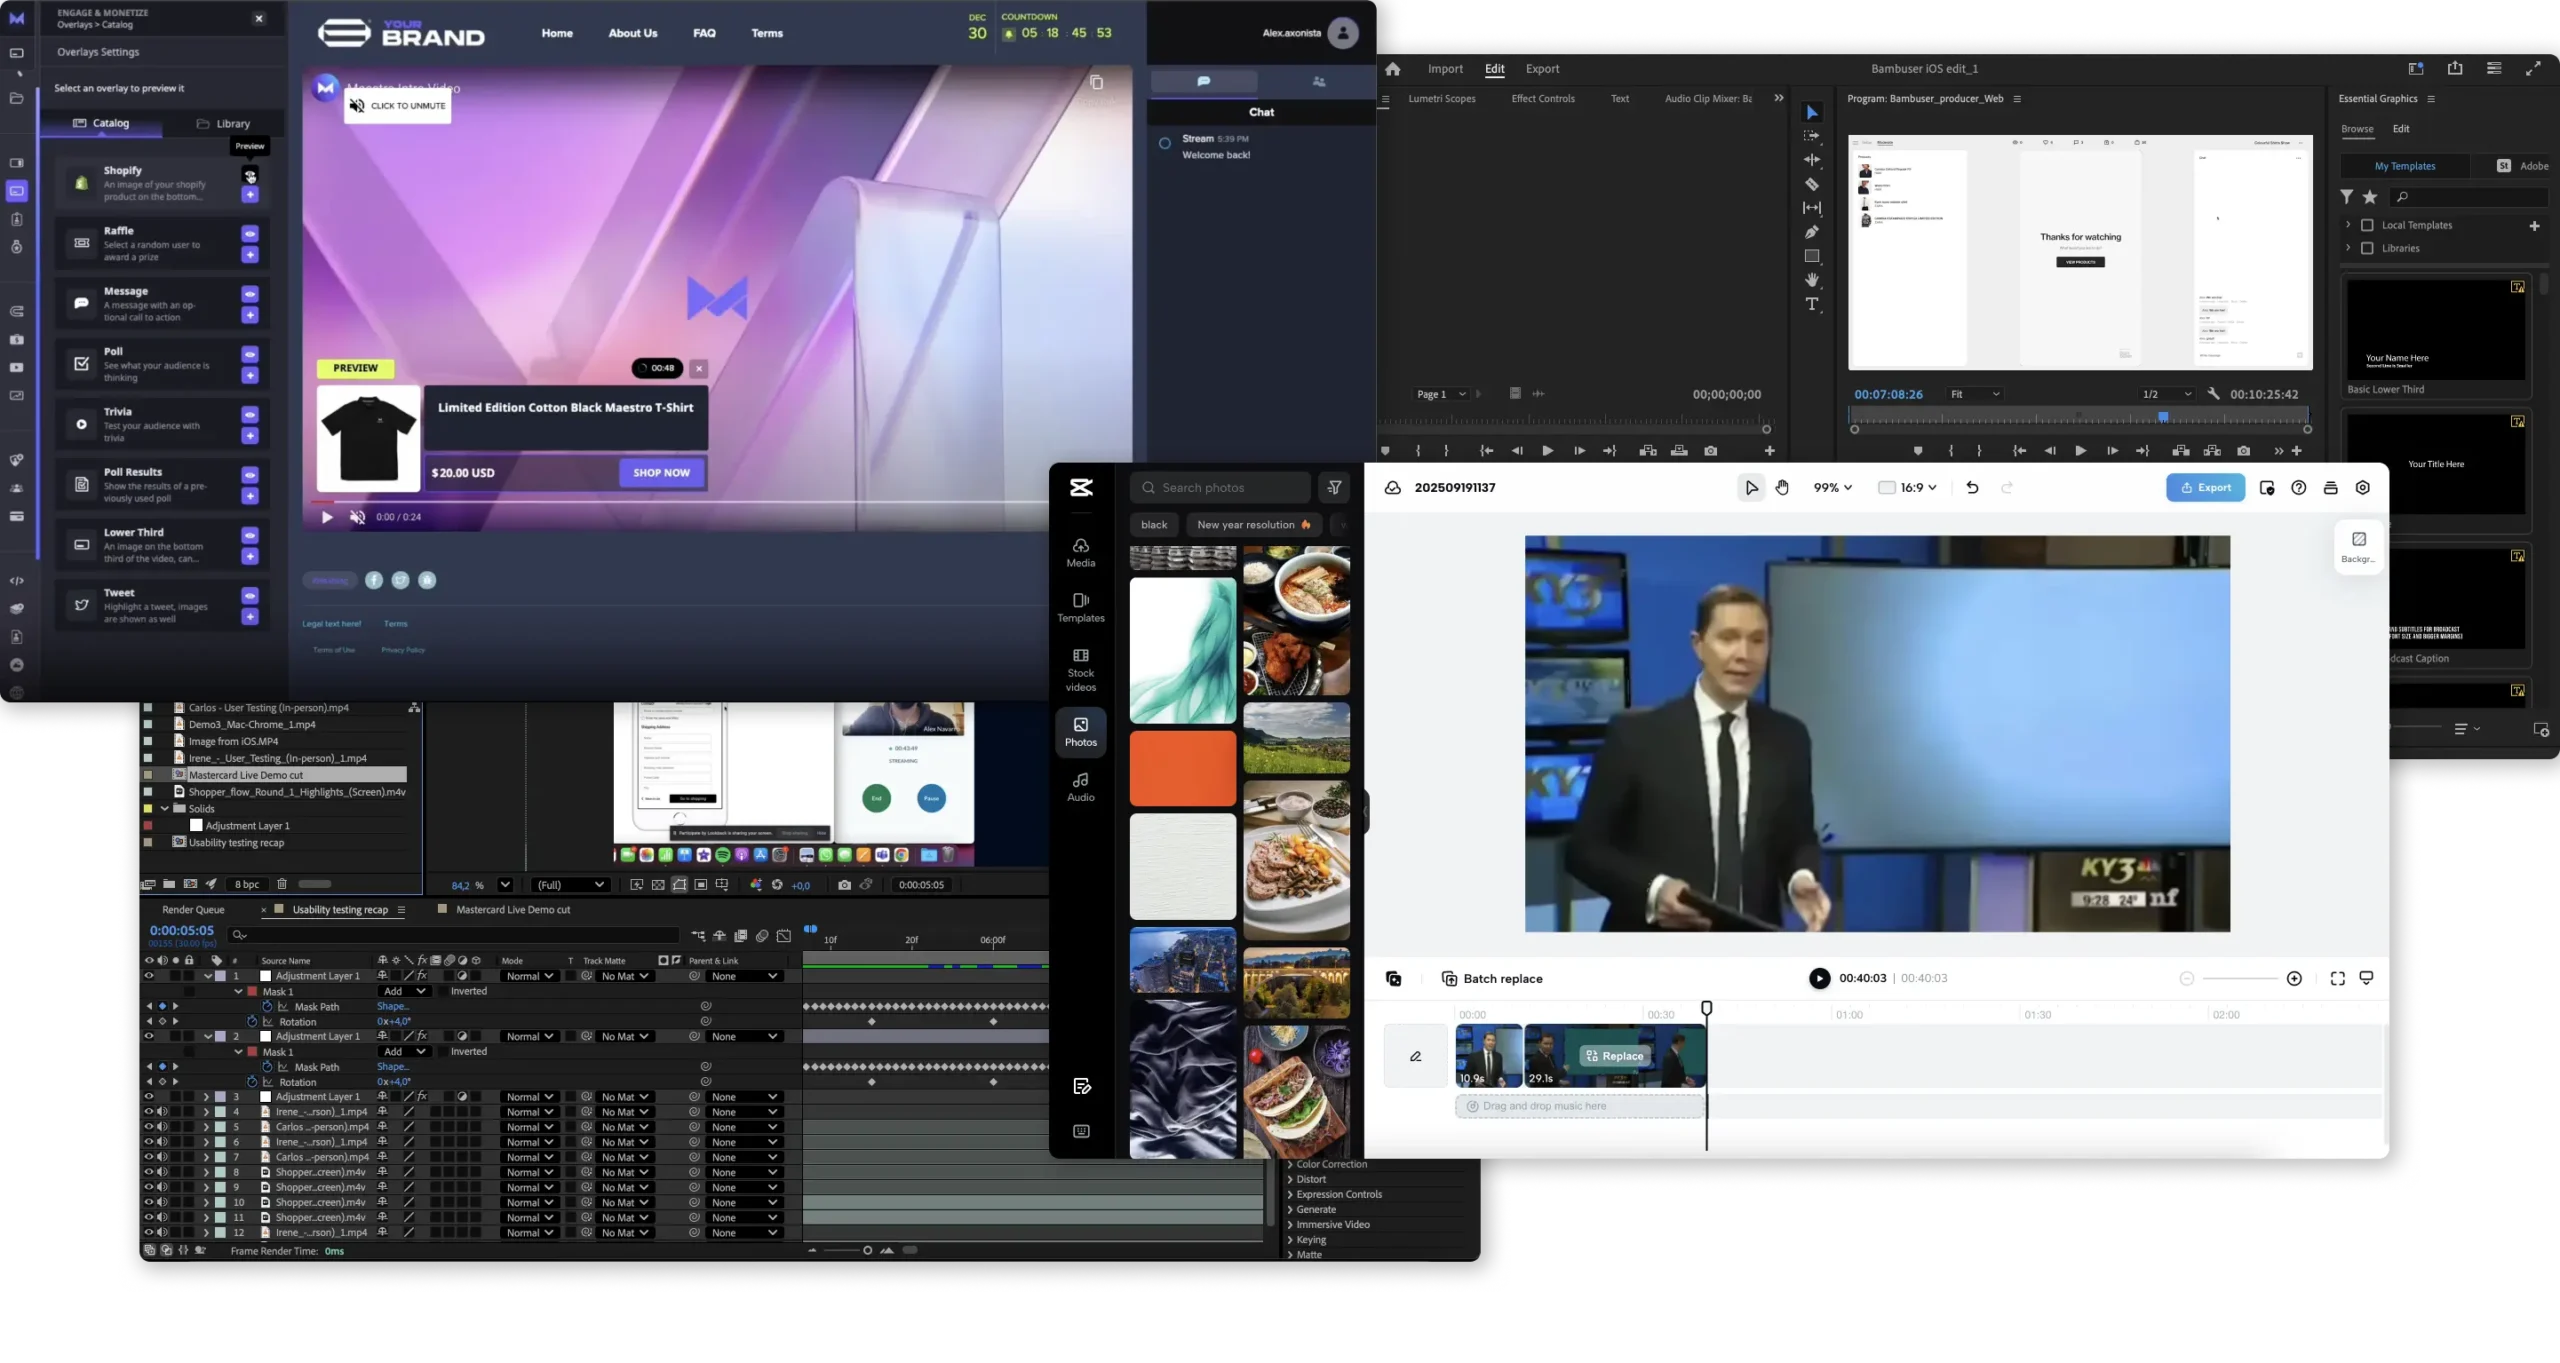
We looked at how professional and consumer video editors handled similar layout problems, and two patterns came up consistently.
The first was panel placement. Most editors position asset panels on the left, letting users search, browse, and organise sources before placing them on the timeline. The timeline itself sits at the bottom, where the actual curation work happens. Items on it show their type, position, and active state at a glance. The video player sits above, reflecting timeline changes in real time.
Our curators aren’t video editors, but the logic of how these tools handle item placement mapped well to our use case. It gave us a defensible starting point without having to invent a new interaction model from scratch.
Existing known issues
A quick round of curator interviews, combined with a review of open Jira tickets, confirmed the timeline was underperforming. Issues had accumulated: difficulty placing products at exact frames, trigger lines too thin to select reliably, no intuitive zoom and no way to navigate long shows efficiently.
At some point, it became clear that the timeline rebuild was actually the higher priority, even over the layout reorganisation.
The quotes from curators made it concrete:
Solution
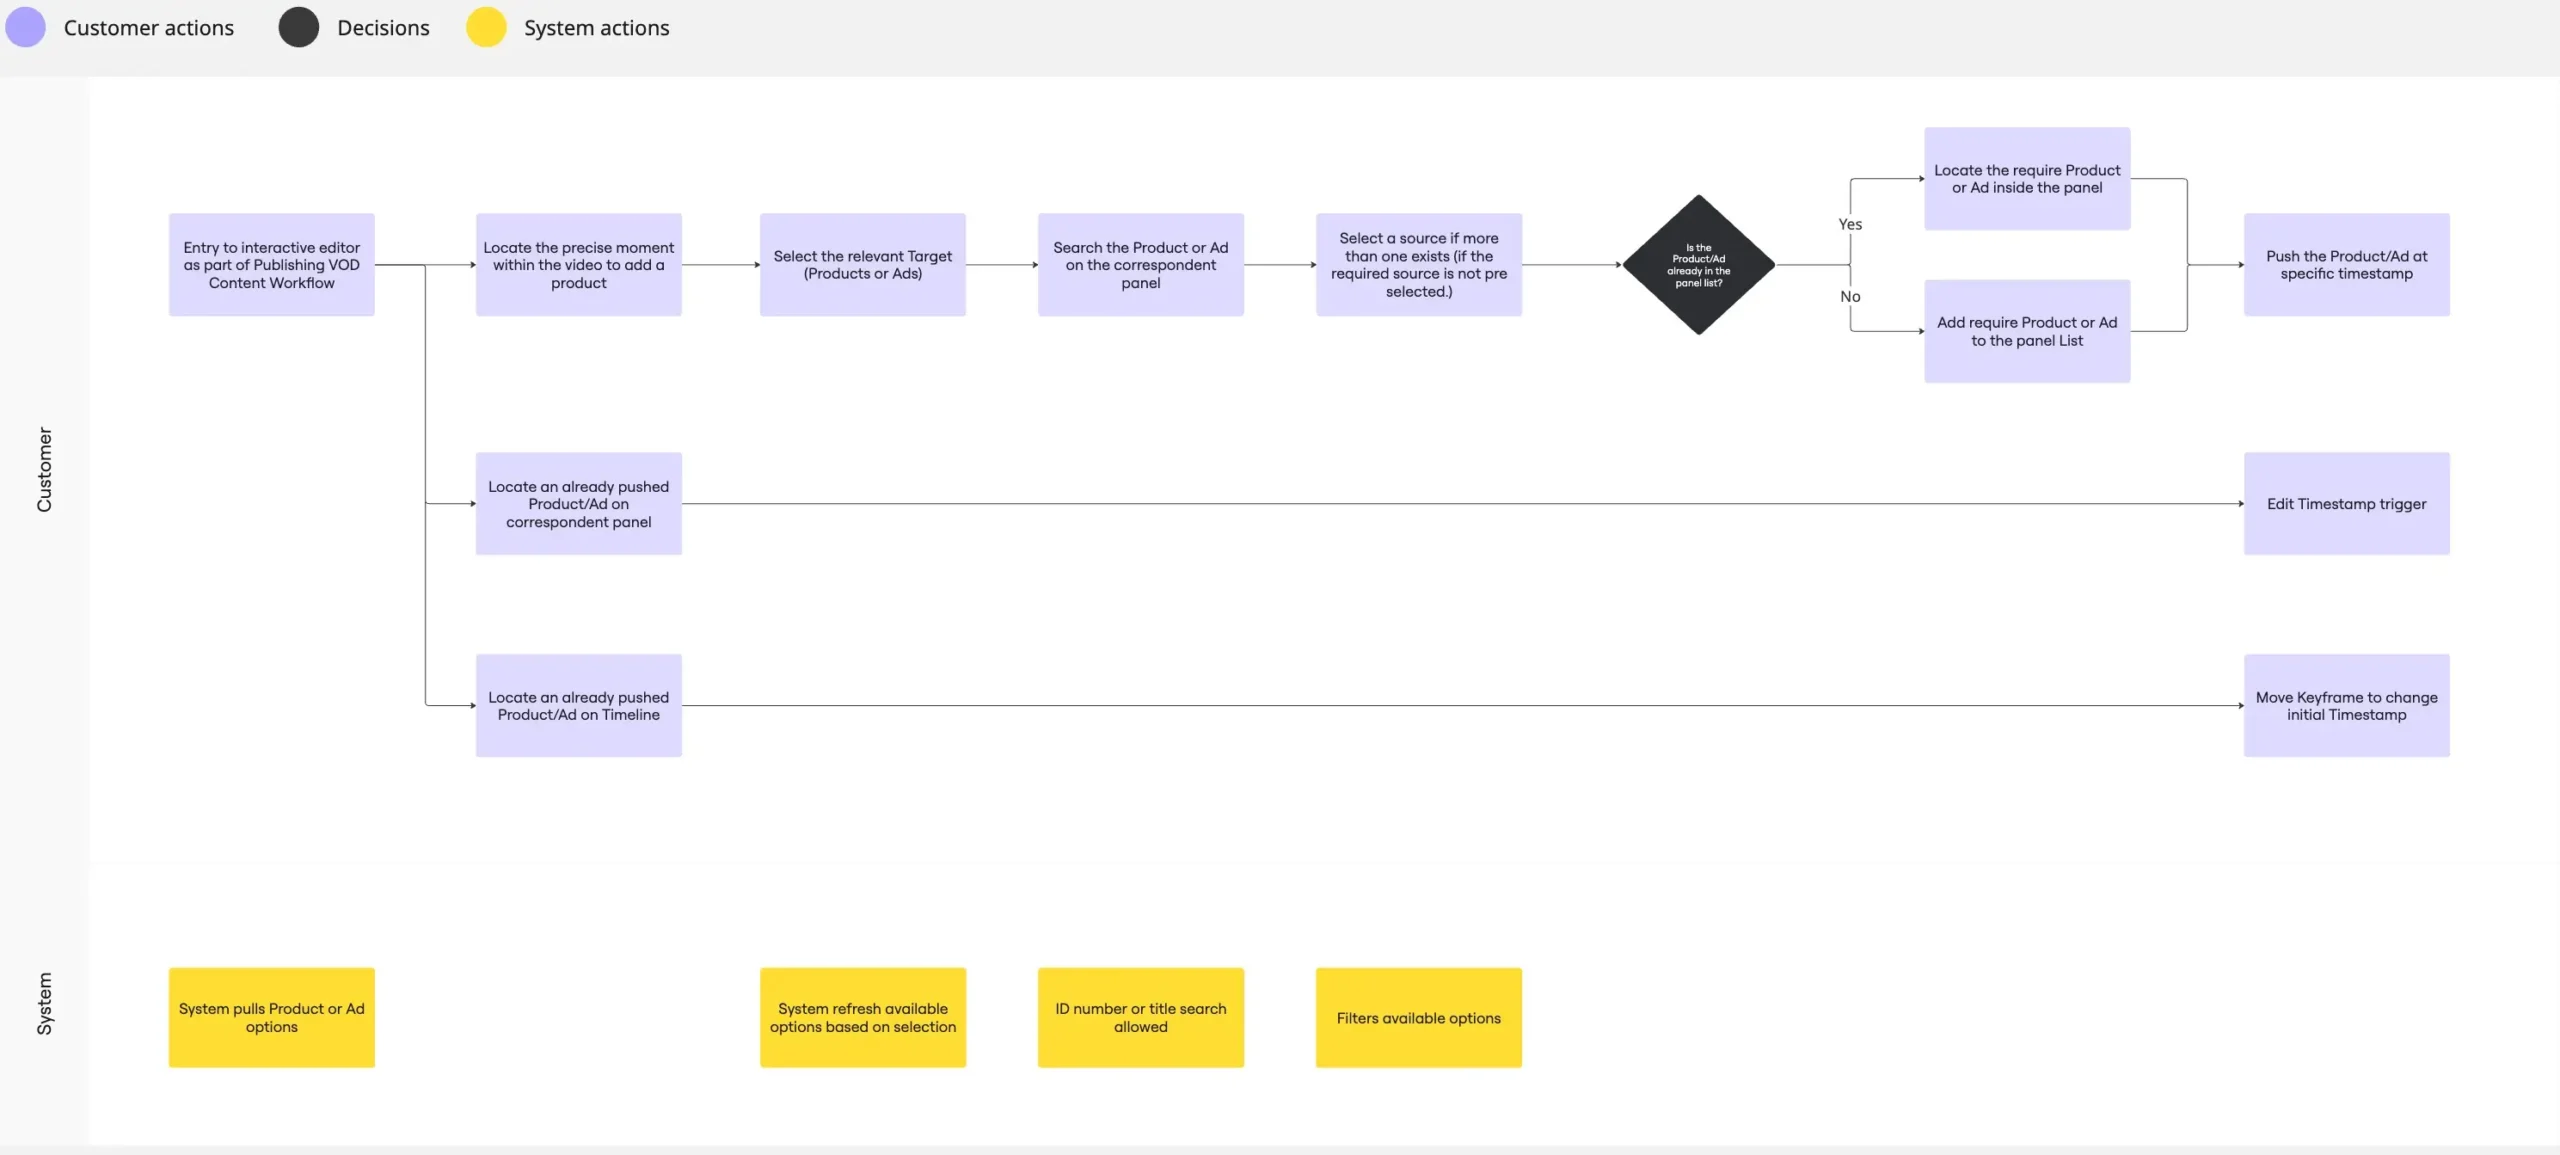
User flow
I mapped how curators currently search for items, add them, and place them as triggers in the video. This made it clear where friction was concentrated: the search-and-place sequence and the timeline interaction itself.
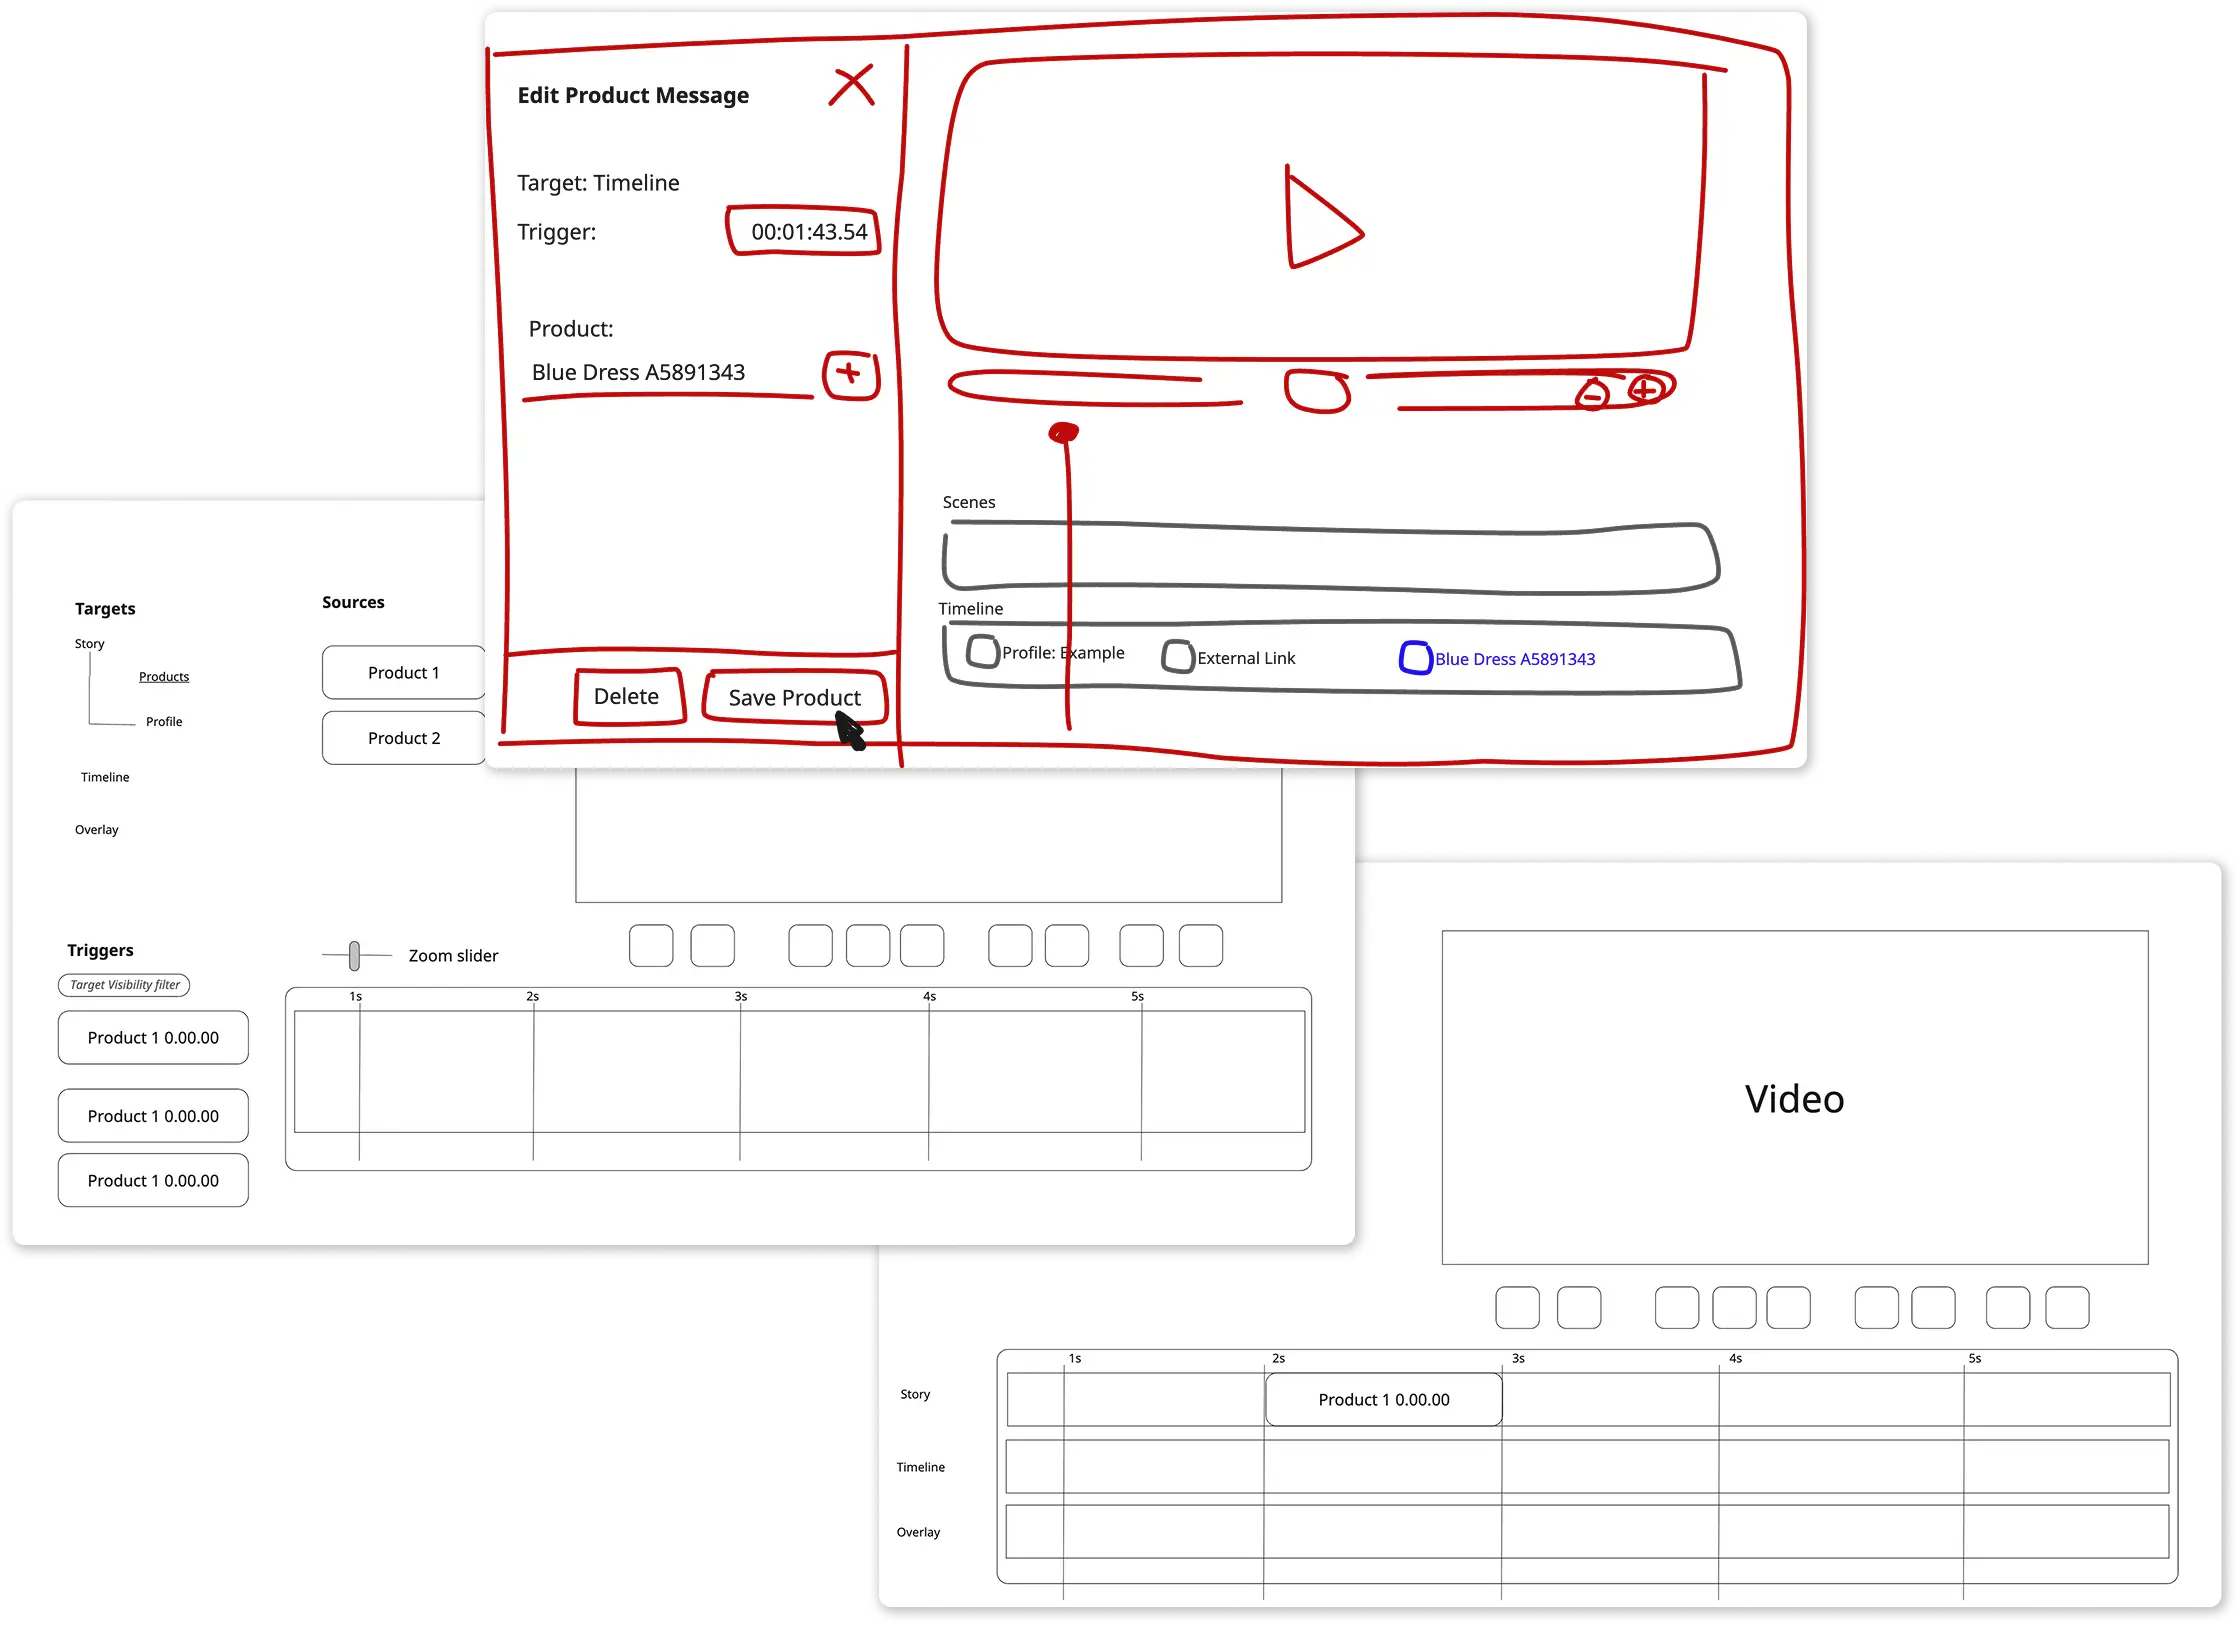
Sketching
With a clearer picture of the barriers, I moved into Miro to sketch potential solutions and pressure-test them against what the developer could actually build. Most of this work focused on the panel reorganisation, how to give curators a faster way to find and add products and ads without restructuring the underlying data model.
A single panel with multiple tabs for Sources and Products was explored, but the code changes required were too extensive for the time we had. Reorganising the existing panels into a more logical order accomplished the same goal.
High-fi Designs
An existing design system for the CMS and only one genuinely new feature meant I could skip wireframes and go straight from sketches to development-ready designs. That compressed the cycle considerably, with less time between “designed” and “something real to test.”
Testing & Iterations
To avoid disorienting existing users, we staged the rollout across two releases. V1 shipped the new timeline. V2 introduced the layout repositioning. One change at a time, with feedback between each.
Panels & Video player
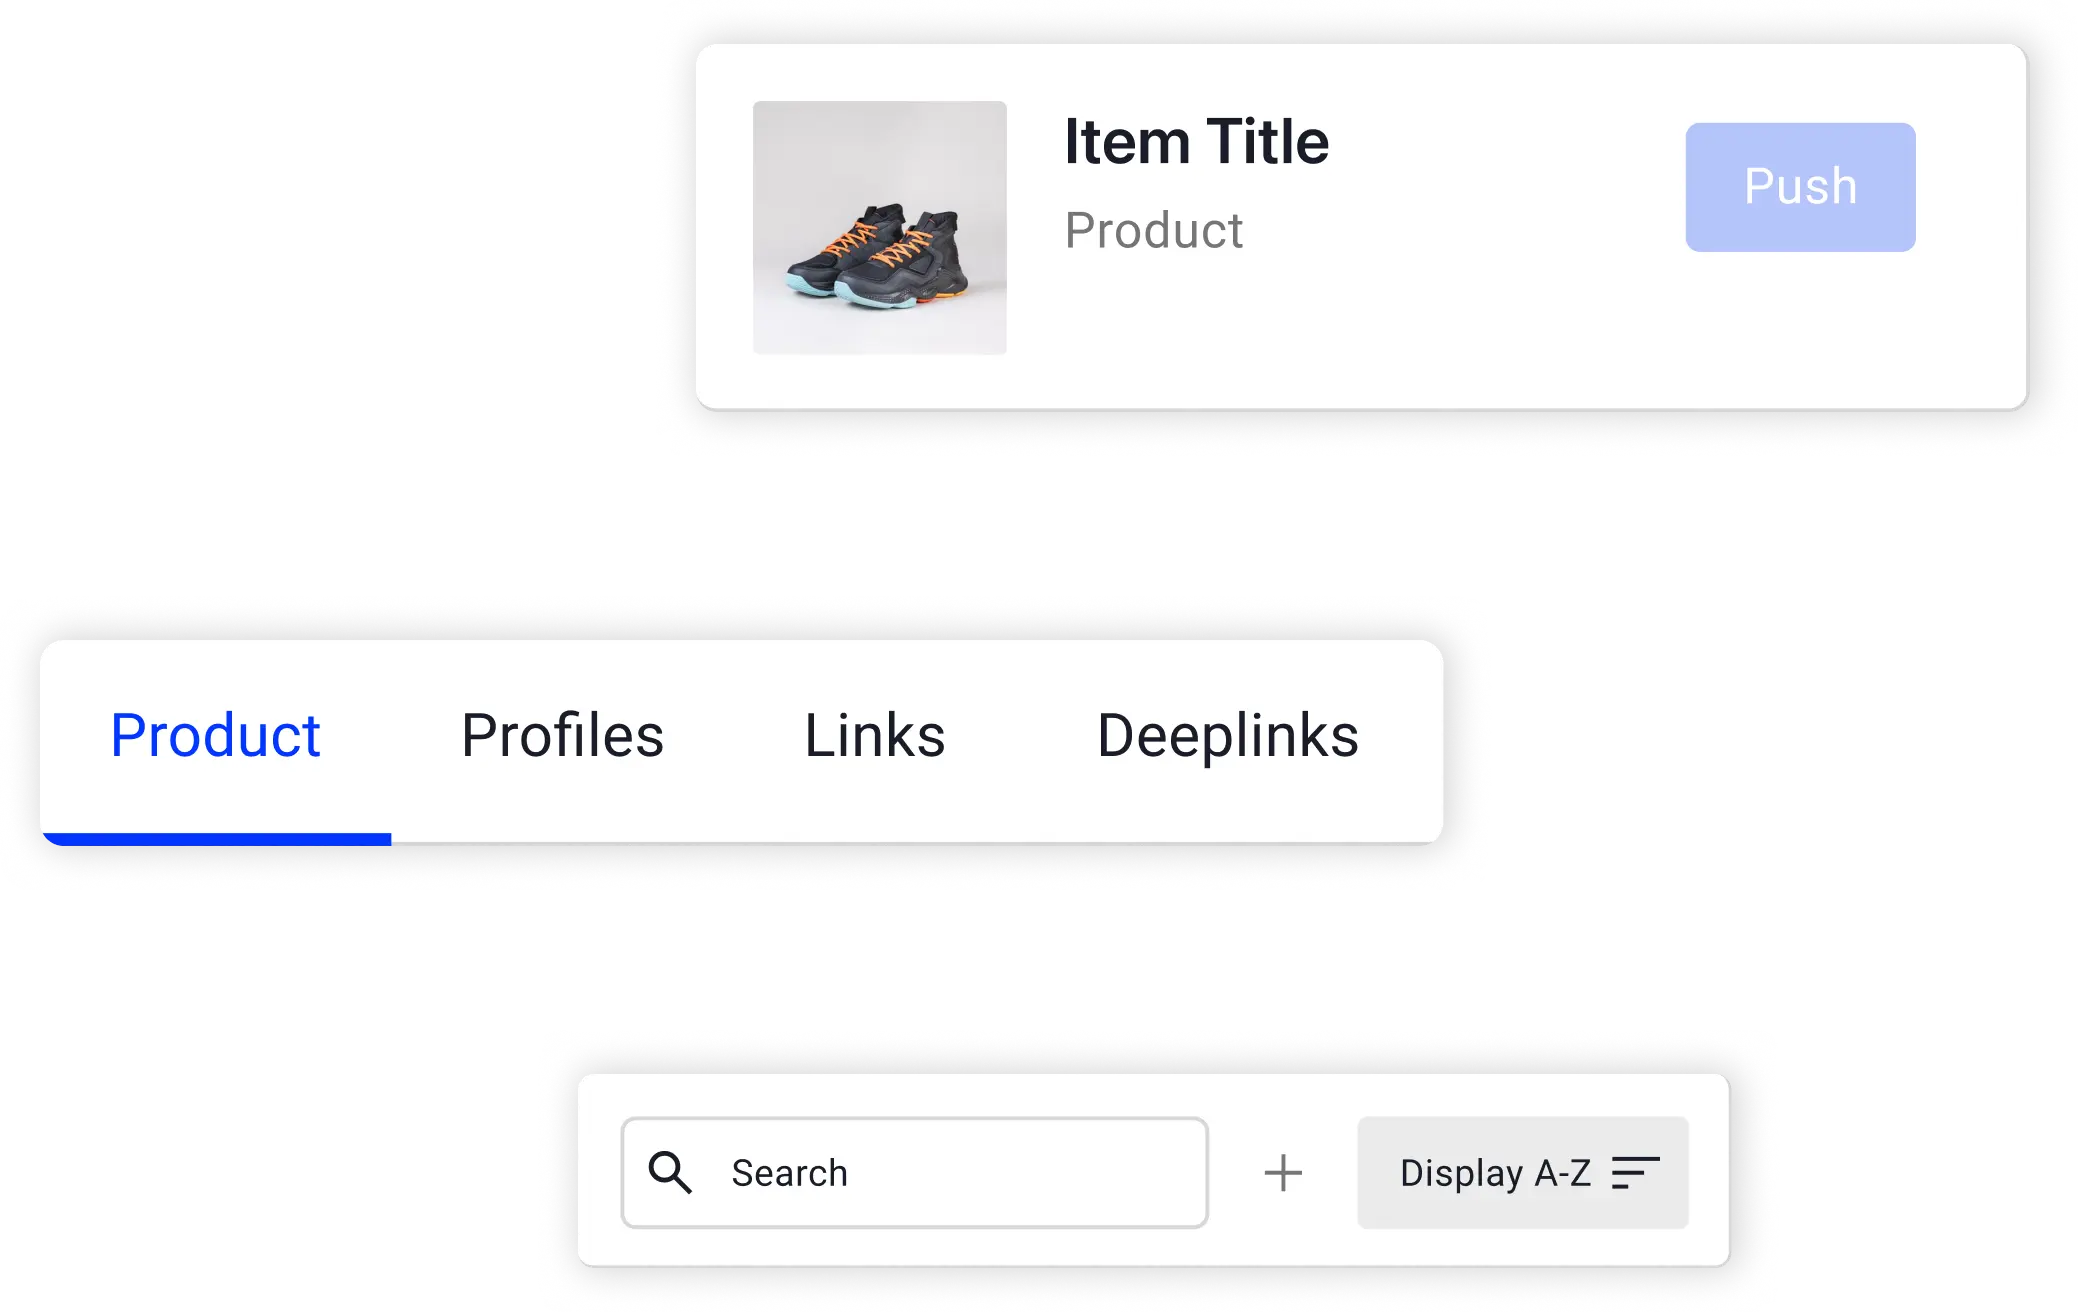
The Targets column determines what appears in both the Sources and Products panels. Since customers can configure a custom number of target types, it made sense to anchor it at the top as a dropdown that sets context for everything below it.
The Sources panel now combines the source types that were previously in a separate left column. One panel, one place to search and push items.
The Products panel, the one that shows all triggers already added to the video, sits next to it. That reflects how curators actually work: add a product, then set the timestamp.
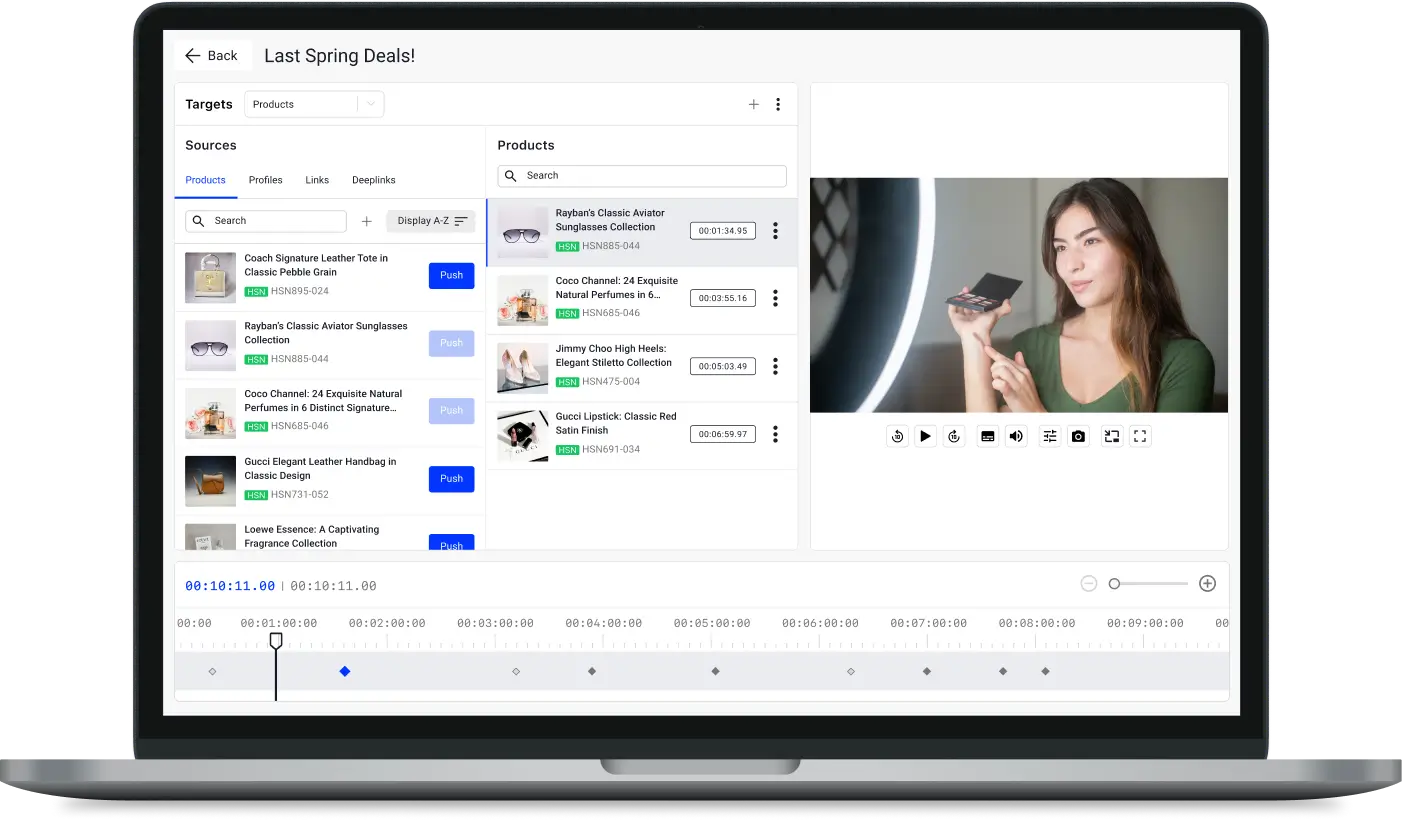
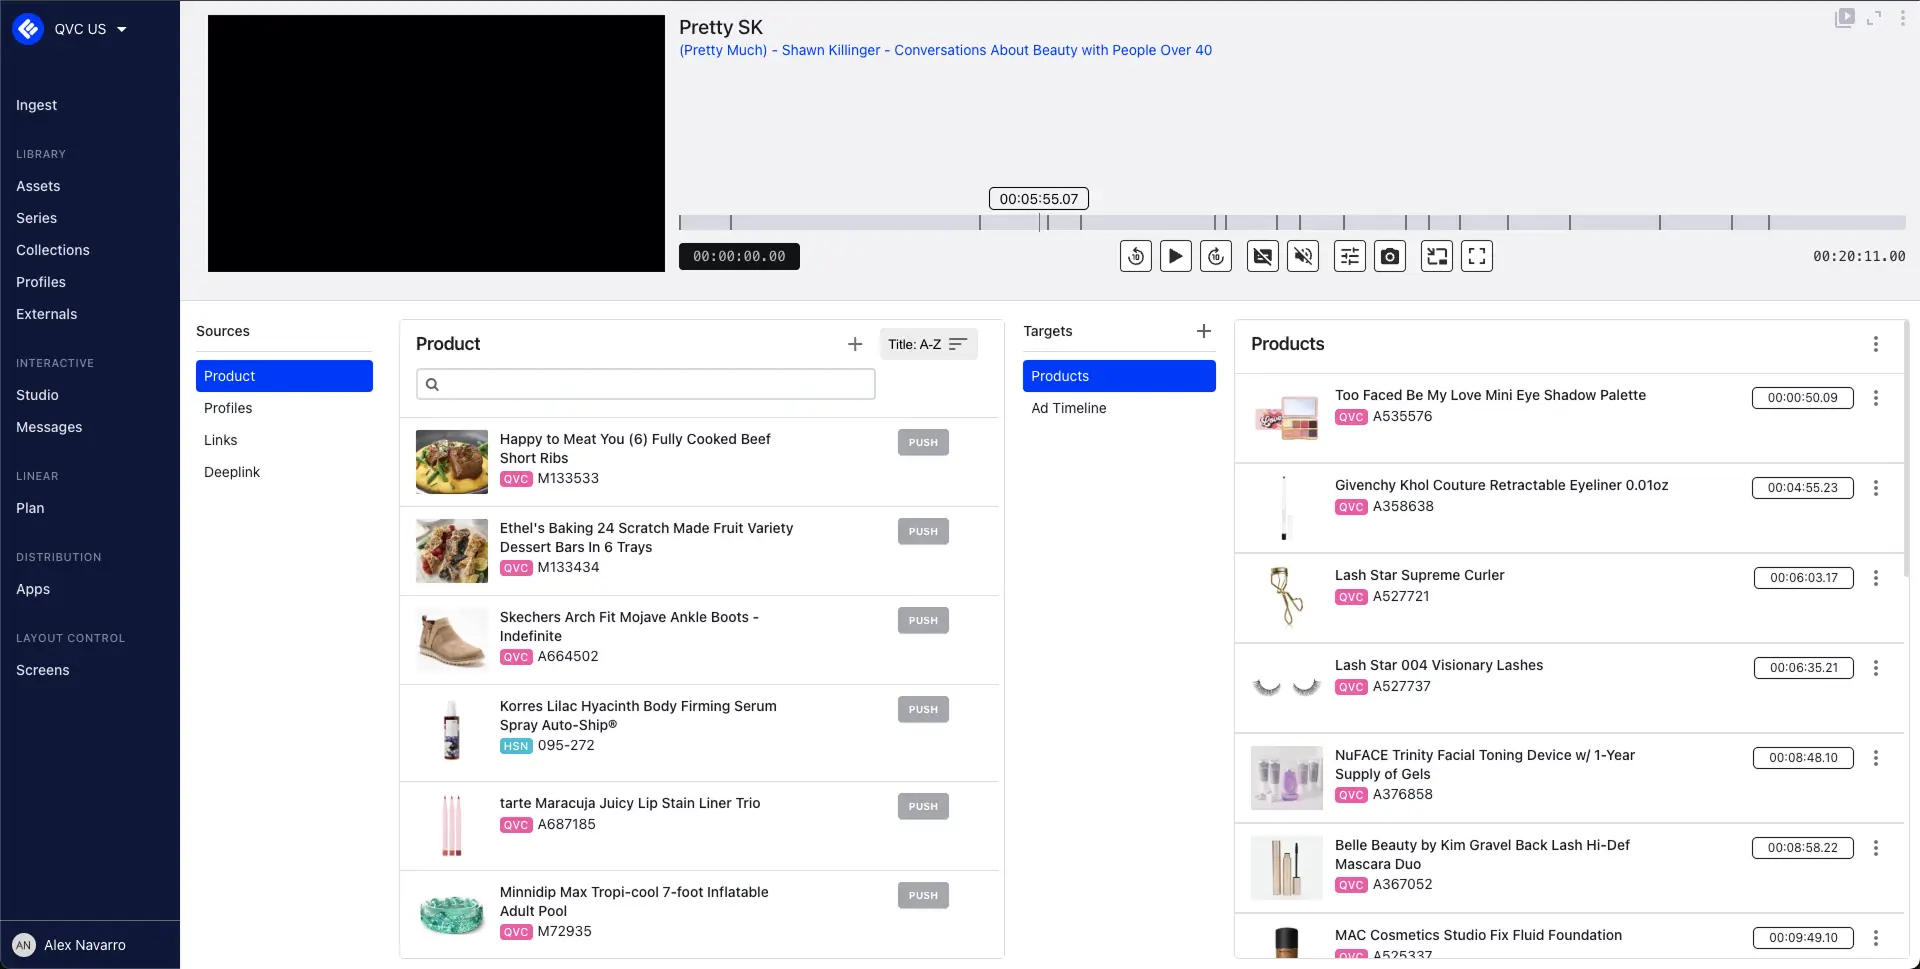
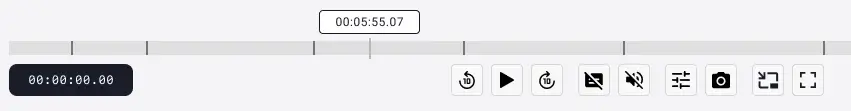
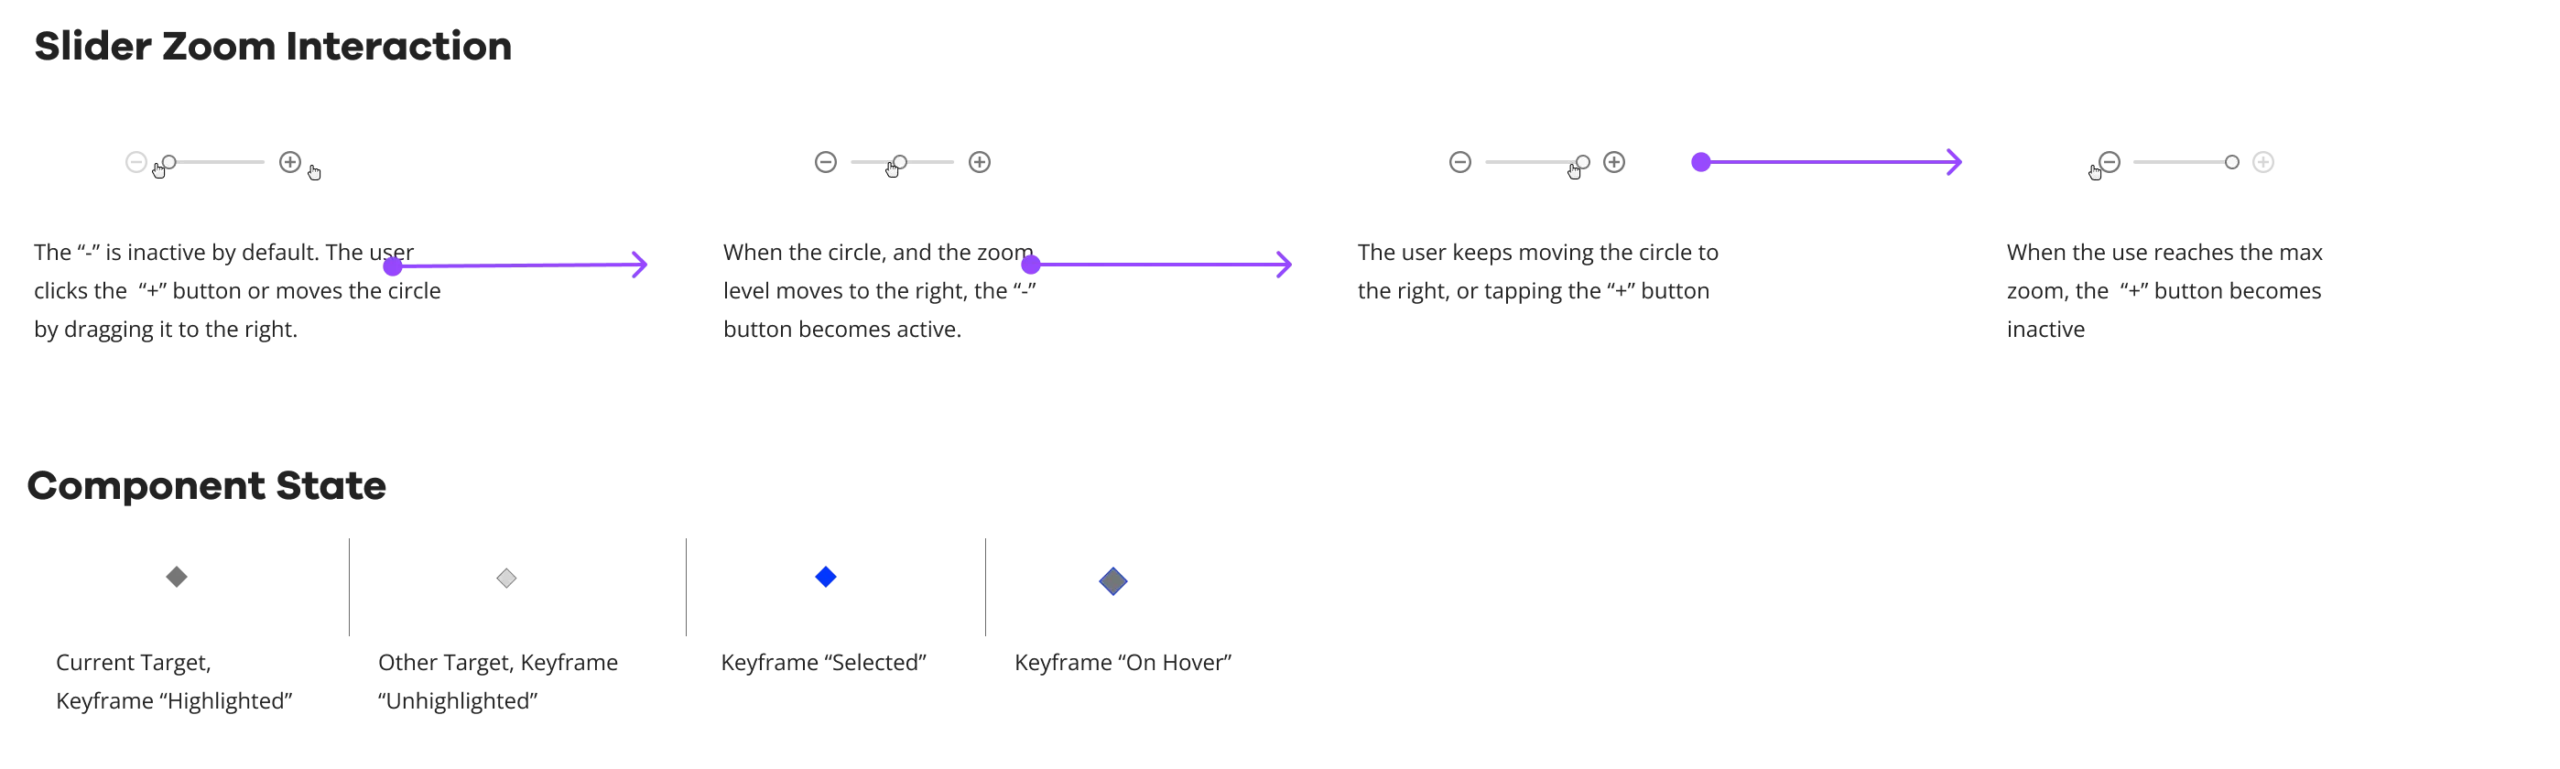
Timeline
With the new Timeline, users can now do what’s expected from it: See in a clear way the current and total time, zoom in & out to have a better vision of product clusters, and scroll horizontally to browse through the ingested products in a wider view by default.
Current example of QVC use
A collateral piece that was also impacted by this redesign was the video player, increasing in size by 20% approx due to the reordering of the panels.
Curators can now find and place products faster, which increases the number of videos they can manage per day.
Impact
Metrics
Jira tickets related to the interactive space dropped to zero. Previously: 4–5 per month.
Timeline interaction rate went from ~40% to ~75% of sessions, the share of sessions where curators actually used the timeline rather than just viewed it.
Time to add a single product trigger fell from 35–60 seconds to 12–32 seconds.
Pool sample: 8 curators from a total of 20 actively using the space. Data extracted from Posthog events.
50
Time on Task Reduction
100
Ticket issues Volume Drop
76
Timeline Interaction Rate Increment
Learnings
Work with what you have to make space for what matters.
A complete panel redesign was probably the best solution, but legacy code made a full schema change impractical in the time available. The reorganisation freed up the time to build the timeline from scratch, which turned out to be the piece that mattered most to users.
Design for your actual users, not users of other products.
Early in scoping the timeline, we planned to add duration indicators, colored blocks showing when each product starts and ends, like other timeline tools. Then we talked to curators. QVC shows don’t work that way: one product follows the next, no overlaps, no gaps. We dropped the feature and left it for a future iteration if other customer types need it.
Some curators wanted more.
Other curators from other clients found the solution useful but wanted a layered view where ads and products can overlap. We drafted it. But given how few curators needed it and how non-critical those tasks were, we pushed it to a future release.